
 I attached here on the left a long term chart where each bar represents one day of market activity.
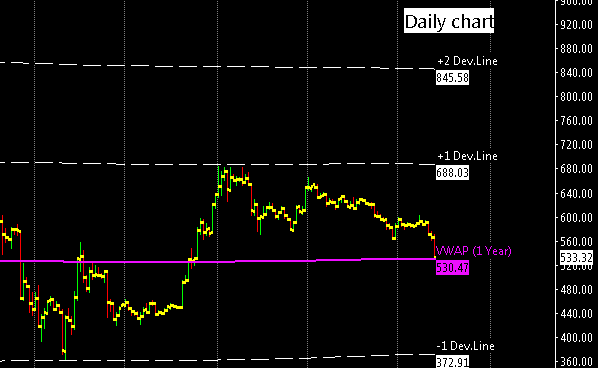
XBT/USD is fully in a short term corrective phase inside a long term bull market because the price recently has been above my one year vwap, now at $530.
I think that if there will not be an increase in volatility it is unlikely that we will see a drop below the VWAP, instead if a small flash crash will develop this month the support could be at about $450 (in between the VWAP and the first negative deviation line now at ~$373)
At this point if I see in the coming days the volume turning positive (it is also a sign of a recovery), I might decide to increase my bullish position.
