Long Term Update: 2024 Outlook with entropic methods

Every year i post an outlook using entropic methods explained in the technical section of this blog. Here you can find the 2015, 2016, 2017, 2018, 2019, 2020, 2021, 2022 and 2023 forecast update, where you can find more information about this approach.

Updated values for bitcoin (in brackets values of 2023) using daily data since August 2010 (from now on I will use only BITSTAMP data, as today there are not many differences between major Bitcoin exchanges.).

   BTC/USD
Growth Factor G 1.00099 (1.00090 )
Shannon Probability P (see this as entropy) 0.52237 (0.5214 )
Root mean square RMS (see this as volatility) 0.0471 (0.049)

The entropy values of Bitcoin versus the USD have experienced a slight improvement in 2023. The Growth Factor (G) has marginally risen to 1.00099% compounded daily or 144% per year, surpassing the 139% observed one year ago. The optimal fraction of your total wealth to invest in Bitcoin has also slightly elevated to 4.5% (~0.52237*2=1.04475 – 1 = 0.04475 or ~4.5%), a figure that can still be rounded to 5%, similar to last year’s recommendation.

The volatility of Bitcoin has not exhibited an increase this year, considering the average value since the inception of its historical series in August 2010. Currently, it maintains a stable position at a relatively high value when compared to other assets such as gold, stocks, bonds, and forex currencies.

It seems that a volatility plateau has been identified, and it is notably substantial higher compared to other assets. This suggests that Bitcoin continues to be a highly speculative asset. In the year 2023, the growth factor of BTCUSD still outperforms traditional markets significantly, except for the Shannon Probability, which aligns closely with that of the US stock market (around 0.52). This implies that, on average, out of 100 days, an asset rises for 52 days and declines for 48 days.

 2024 Price forecast  Full Historical Volatility  Half Historical Volatility
Forecast using only G* or Growth Factor ~61,400$ ~61,400$
Upper bound adding volatility ~151,000$ ~96,000$
Lower bound subtracting volatility ~24,900$ ~39,000$

*61400 is obtained with 1st January as a starting price (around 42650$) times (1.00099^365)=~1.44   |  42650*1.44=~61400$, just change 365 with the number of days you prefer for a different forecast.

What happened in 2023? 

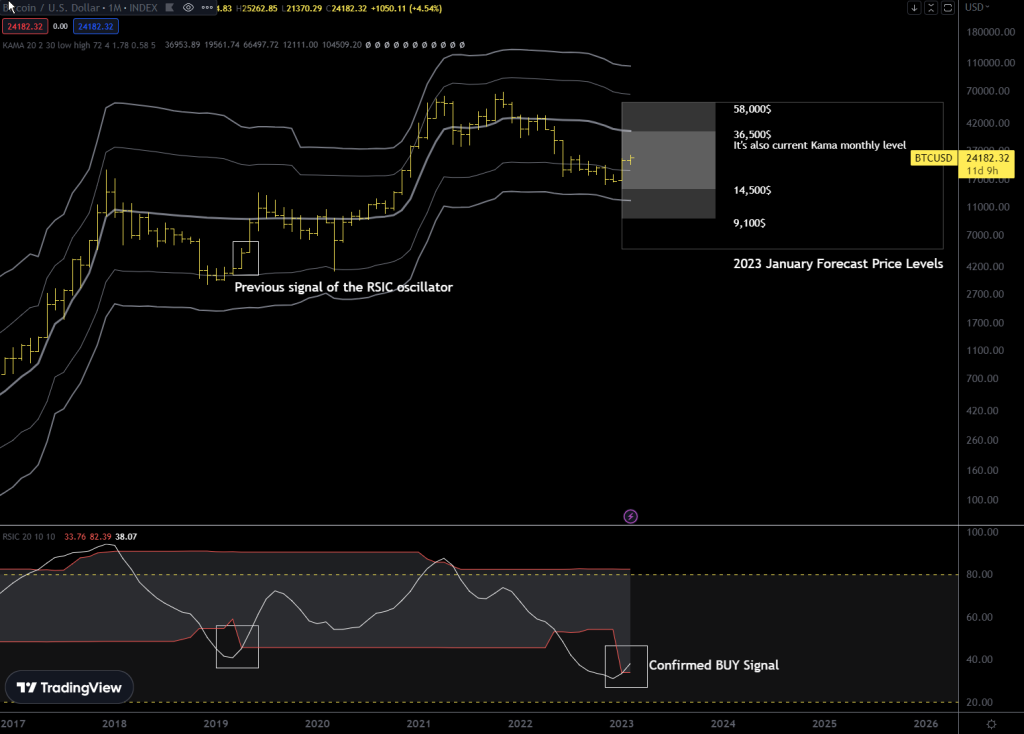
A year ago, I predicted an upper boundary of $58,000 using full volatility and about $36,500 using half of historical volatility, these two targets were calculated based on the opening price on January 1, 2023, which was around $16,500. The calculated support levels were $9,100 and $14,500. 
The year has proven positive, surpassing the initial calculated resistance level of $36,500, which coincided with the monthly KAMA average. This signals a notable strength in the uptrend, with BTCUSD transitioning from a position of weakness to one of strength by rising above the monthly average.

Conclusions

For this year, it might be a smart move to also consider a lower value for volatility, let’s say 25% of the historical volatility, as I don’t expect a new all-time high but rather a consolidation phase a few months before, during, and after the halving. Therefore, determining a resistance level at around $77,000, calculated with a precise 1/4 of historical volatility—a method I don’t typically employ but find plausible for this year. This is due to my belief that it might be challenging for the volatility to remain high for a significant amount of time, making it less likely for BTC to surpass this $77,000 level.

I might consider taking profit if the market shows signs of weakness around this level. I remind you guys that I had opened a bullish position in February 2023 at approximately $22,500.

Furthermore, I have cautious long-term trading recommendations for you this year. The hype surrounding ETFs might culminate in a “sell on news” scenario on the day the ETF gets approved. There’s a possibility of subsequent gradual declines in Bitcoin prices toward calculated support levels for the next year, ranging between $24,000 and $39,000. Don’t forget that the most probable support area is around the monthly Kama, which is inside the support windows for this year ($24,900-$39,000).

Instead of anticipating any catastrophic scenarios this year, in contrast to the previous year, which appeared more susceptible to bearish scenarios, I maintain my view of the $24,900 support as very solid.

About the upper bound i’ve to admit that it is very unlikely to reach and/or break $151,000 during 2024.

I’m at your disposal for any questions; see you at the next update and Happy New Year!

Charts

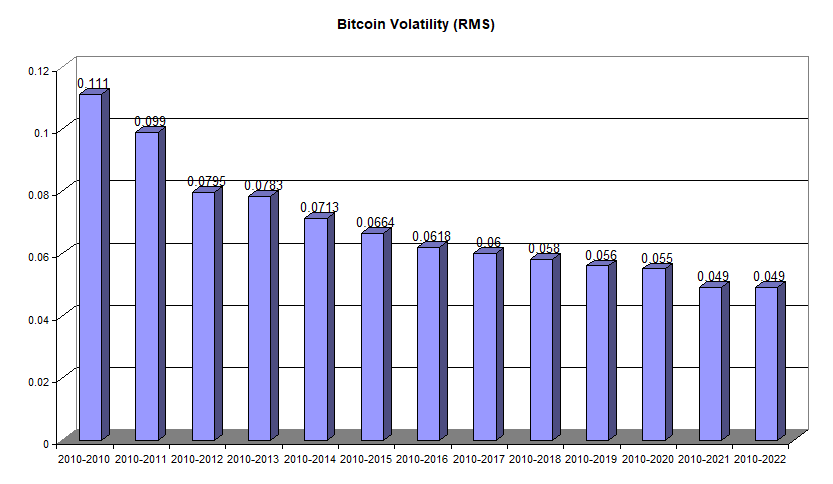
Bitcoin’s cumulative volatility as expected is dropping every year and is stabilizing towards a value that is still a bit high compared to other traditional assets (stocks, gold, bonds range from 0.01 to 0.03) but the very high average returns of btc compensate the high volatility. The values represent the root mean square of logarithmic returns of bitcoin daily data.
The first lower monthly kama average price band will probably slowly reach the $25,000 support level during the 2023.
I’ve added the equilibrium point computed using the G growth factor at $61,400.
The chart is monthly and begins at the end of November ’22 bottom.

Long Term Update: The Big Picture part II

BTCUSD Monthly Chart Jan 2021 to present day

For all my Italian followers, I am pleased to announce that my analysis are now available in Italian on bit-reminder.com. This Italian website, which I collaborate with, is a valuable resource for those interested in the cryptocurrency world, with lots of information and a technical analysis section authored by me. In addition to covering Bitcoin, from time to time I also discuss some altcoins using the same approach, utilizing the CRSI oscillator and KAMA price bands. You can find the Italian version of this article on that website as well.

Since I last made my prediction in February, Bitcoin has continued to rise and is now approaching the resistance level of $36,000. However, bitcoin is hesitating just below this critical level of $36,000 without a clear breakout. The modified RSI oscillator is approaching the overbought level, so probably we are two to three months from a top.

Based on the Kama average levels, my earlier prediction of a target range of at least $36,000 with a maximum potential upside of $58,000 still stands. However, given the current market conditions, it’s difficult to say whether we will see a new intermediate top this year. However, there is still a significant portion of May left, so it will be interesting to see how the market develops in the coming weeks and if there is enough fuel to approach $36,000 before end of June and possibly break it to hope to see $50,000 by the end of the year.

Short Term View

BTCUSD Daily Chart


For those who follow me on Twitter, they already know about the situation in the short term. Since the market’s corrected inversion on April 25th, it has been weak and moving sideways. There is a possibility that it might drop to $25900, which could result in my CRSI becoming oversold and recharging itself, potentially leading to a new short-term buy signal.

Long Term Update: The Big Picture

BTCUSD Monthly Chart with KAMA+Deviation Bands, RSIC oscillator confirming new buy signal

In the chart above, there is a new buy signal from a modified RSI oscillator after an apparent four-year interval, with a smoother output compared to the original. My yearly prediction, which I typically release in January, appears to be consistent with the Kama average levels. The estimated target range for this upward movement is at least around $36,000, with a maximum potential upside of $58,000. As a result, I believe that we will not see a new all time high during this year.

It can be noted that the examined oscillator also gave two bearish signals in 2017 and 2021, at the respective peaks of the four-year bitcoin cycle.

Does the 4-year halving cycle exist or not?

While many people believe in the 4-year cycle of Bitcoin, which is linked to the halving phenomenon, I personally think that this effect is not significant. The price of a commodity, including Bitcoin, is mainly determined by the supply-demand balance and the liquidity of the market, rather than by scarcity or safe-haven properties. Indeed, there are many scarce things in the world that have no value simply because there is no demand for them.

In my view, Bitcoin’s price is affected by liquidity cycles and the interest of investors in the asset for various reasons. When the liquidity provided by central banks decreases, Bitcoin’s price is likely to bottom out as well. However, it may take many years for Bitcoin to overcome the influence of central banks, given their significant impact on the global financial system.

In practice, if we measure it, the long term cycle we can find in Bitcoin is three years and a three months (on average), which surprisingly resembles the liquidity cycle in China observed in its 10-year bond yield, CN10Y.

10 Year Chinese bond and major Bitcoin tops

It is important to acknowledge that the Chinese 10-year bond yield can be influenced by central banks, including the People’s Bank of China. This is because bond yields reflect the expected return for investors who hold them until maturity, and interest rate changes can impact the bond’s value. Central banks have the power to adjust interest rates through various monetary policy tools, such as altering the money supply, setting interest rate targets, and buying or selling assets like bonds.

Therefore, movements in the Chinese 10-year bond yield can serve as an indicator of shifts in monetary policy, which may have a ripple effect on other asset classes, including Bitcoin. It’s worth noting that Bitcoin is known for its high volatility, and any changes in monetary policy could potentially affect its value as well in a dramatic way.

It’s important to keep in mind that the total market capitalization of Bitcoin is currently around half a trillion dollars, while the liquidity being moved by central banks is much larger, estimated at around 100 trillions dollars. The impact of monetary policy decisions by central banks on Bitcoin’s price may be significant at this point, given the relatively small size of the Bitcoin market compared to the global financial system. However, as the market value of all existing Bitcoins grows over time, it may become more resilient to external factors, including monetary policy decisions. Nonetheless, it’s likely that the influence of central banks on Bitcoin will continue for many years to come.

We can observe that in the current cycle, approximately 20 months have passed from the peak in 2021 to the recent bottom. Based on this, we can hypothesize that the current cycle may be 40 months long, which is in line with the previously calculated value of 39 months (3 years and 3 months).

I hope you enjoyed the article, and I would like to invite you to comment and share your opinion. You can comment here or on Twitter. If you are Italian, an italian version of this article is available at bit-reminder.com

Portfolio Update: Long 1 unit at 22451$

LONG TERM
1 unit bought at 22451$

SHORT TERM
No position open

As someone who is interested in long-term investments, I recently made the decision to buy bitcoin at a price of 22451$. I will explain the reasons that led me to make this decision.

The first reason is based on technical analysis. An oscillator indicator, which measures momentum, has recently given a bullish signal on the monthly chart of bitcoin. This is a strong signal indicating that the price of bitcoin is likely to continue rising in the coming months like it did in 2015 and 2019, this oscillator is a modified version of the classic RSI indicator.

The second reason is related to price action analysis. After testing the first resistance of the weekly chart, the price of bitcoin has retreated to the weekly moving average, which has provided strong support. This is a positive sign, and it suggests that the price of bitcoin is likely to continue its upward trend and should reach the $30,000 mark.

The third reason for my decision to invest in bitcoin is based on a longer-term trend analysis. It has been enough time since the top of 2021 to justify a period of consolidation, with a low point slightly above $15,000. This bottom is still quite high compared to the one of 2019, confirming that the overall trend of bitcoin is still strongly upward.

In conclusion, my decision to buy bitcoin at a price of 22451$ is based on a combination of technical analysis, price action analysis, and long-term trend analysis.

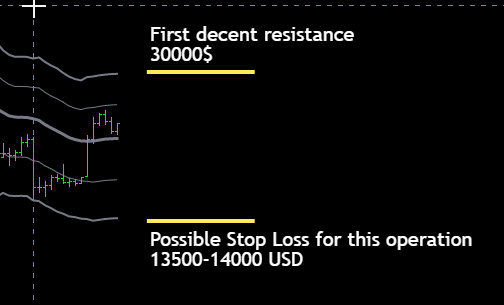
Stop loss is wide as usual for long term trades, support is the 2nd price band on weekly chart, if the price of Bitcoin falls below $14,000, I may need to reconsider my position and potentially exit the trade.

On the upside, the first significant resistance level is at $30,000. This means that if Bitcoin is able to break through this level, there could be significant upside potential for the trade, breaking through the $30,000 resistance level could potentially set Bitcoin up for a bullish trend towards the yearly forecasted resistance level of $58,000, which was predicted back in January in my yearly forecast.
More info in the upcoming updates.

Weekly BTCUSD Chart
Weekly Chart BTCUSD with KAMA average and price deviation bands, price is holding above the Kama average now at 21000$

Long Term Update: 2023 Outlook with entropic methods

I will be busy in the coming days, so the yearly update for 2023 is being released early.

Every year i post an outlook using entropic methods explained in the technical section of this blog. Here you can find the 2015, 2016, 2017, 2018, 2019, 2020, 2021, and 2022 forecast update, where you can find more information about this approach.

Updated values for bitcoin (in brackets values of 2022) using daily data since August 2010 (from now on I will use only BITSTAMP data, as today there are not many differences between major Bitcoin exchanges.).

   BTC/USD
Growth Factor G 1.00090 (1.00130)
Shannon Probability P (see this as entropy) 0.5214 (0.5254)
Root mean square RMS (see this as volatility) 0.049 (0.049)

The entropy values of Bitcoin versus the USD have remained relatively consistent in 2022. The Growth Factor (G) has decreased slightly to 1.00090% compounded daily or 139% per year, which is less than the 168% seen one year ago. The optimal fraction of your total wealth to invest in Bitcoin has slightly decreased to 4.3% (~0.5214*2=1.0428 – 1 = 0.0428 or 4.3%, which is still roundable to 5% like last year).
The volatility of Bitcoin, unlike in previous years, has not decreased this year if we consider the average value from the beginning of the historical series, around August 2010 and it appears that for now, it remains stable at a fairly high value when compared to other assets such as gold, stocks, bonds, and forex currencies.
Despite a challenging year in 2022, the BTCUSD growth factor is still much better than traditional markets, except for the Shannon Probability, which still matches that of the US stock market (around 0.52). This means that on average, out of 100 days, an asset goes up 52 days and down for 48 days. 

 2023 Price forecast  Full Historical Volatility  Half Historical Volatility
Forecast using only G* ~23,000$ ~23,000$
Upper bound adding volatility ~58,000$ ~36,500$
Lower bound subtracting volatility ~9,100$ ~14,500$

*23000 is obtained with 1st January as a starting price (around 16500$) times (1.0090^365)=~1.39   |  16500*1.39=22900, just change 365 with the number of days you prefer for a different forecast.

What happened in 2022? 

A year ago, I predicted an upper boundary of $199,000 using full volatility and about $123,000 using half of historical volatility, these two targets were calculated based on the opening price on January 1, 2022, which was around $48,000. The calculated support levels were $48,000 and $29,800. 
It has been a negative year as we have never gone beyond the first calculated support level of $48,000, indicating a general weakness, while some support at $29,800 was seen during the year until May, after which even that level was abandoned and broken to the downside.
It should be noted that the first support at $48,000 acted as resistance during the spring when Bitcoin was unable to break through this support from below. When yearly supports act as resistance, it is evident that the market is weak.

Conclusions

I do not have any clear long-term trading recommendations for you this year as the Federal Reserve’s change in monetary policy to combat inflation has reduced the liquidity necessary to support strong Bitcoin prices. It may be wise to wait for a potential change in policy, but I expect Bitcoin prices to gradually decline towards calculated support levels for next year ($9,100 and $14,500). Based on my analysis using monthly bands based on Kaufman’s average, the most probable support area is around $12,000 (as shown in the chart section below), inside the 9,000$-14,000$ support price range for 2023.

If market volatility increases significantly above historical average, it may be a good opportunity to engage in a short-term trade by buying Bitcoin within the price range of $6,500 to $9,000. The value of $6,500 has been calculated using twice the historical volatility of Bitcoin as a reference and I consider it a rock solid support level in the event of a catastrophic market downturn.

If there is an improvement without making new lows, it is evident to me that resistances should be sought around $36,000, where we have the first resistance level computed with entropic methods and where there is also the monthly Kama average.
It is very unlikely to break $58,000 during 2023.

Unfortunately, this year I do not have a clear idea, I remain pessimistic however looking for a target at $12,000 where eventually buy something should I notice an improvement in market liquidity.

I’m at your disposal for any questions; see you at the next update and Happy New Year!

Charts

Bitcoin’s cumulative volatility as expected is dropping every year and is stabilizing towards a value that is still a bit high compared to other traditional assets (stocks, gold, bonds range from 0.01 to 0.03) but the very high average returns of btc compensate the high volatility. The values represent the root mean square of logarithmic returns of bitcoin daily data.
The second lower monthly kama average price band will probably slowly reach the $12,000 level during the 2023.
I expect to find similarities between the levels calculated in the Kama indicator i use and those used with this approach, the formulas for calculating the bands in my indicator are the same as those used in this update.

Quick Update and general considerations

In the last update in May 2022, I hypothesized that Bitcoin would not remain above the annual forecast support, set at 29,800 dollars. At the time, I also hypothesized a possible test down to the first support of my monthly Kama average, at around 22,000 dollars, a test that then materialized.

The problem is that bitcoin did not hold that support and the next support, in May, was around 14300 dollars. The monthly kama average that I use, unfortunately, is no longer as flat as it was in May but is starting to take a negative slope. For those who have been following me for a while, you should know that I measure the intensity of the trend by looking at the ratio between volatility and the intensity of the signal that the kama average measures.
This value has not yet exceeded the threshold value of 0.30 that decrees the existence of an ongoing trend, but we are very close. So at the moment a downward trend is not yet confirmed on the monthly chart of Bitcoin but it is close. A similar situation occurred in the distant July-August 2015, at the time then Bitcoin made a bottom in the following months before starting to rise again towards the 2017 bubble.

Some things have changed since 2015, Bitcoin is no longer so small in terms of market capitalization, it has attracted institutional investors who follow different logic from the investors who owned Bitcoin in 2015.
Today, those who invest in Bitcoin, in my opinion, are still influenced by traditional markets with their logic and especially by the monetary policies of central banks that are no longer as accommodating as they have been during most of Bitcoin’s existence.
A liquidity crisis, triggered by central banks in recent months, can only harm Bitcoin or at least slow it down and that is exactly what we are seeing in these months. I believe that the current scenario will continue at least until the first part of 2023 and this will probably lead Bitcoin to test the 14300 $ support of the May 2022 support, a support that today unfortunately has fallen to 12300 $ becasue of a slight downwards drifting phenomenon of the supports of my monthly average.

A New Approach to Price Bitcoin

In the comments section of my previous post “Will it work?”, I responded to some followers by introducing a model that I am developing in an attempt to correctly price Bitcoin. I believe this model is an improvement over the well-known stock to flow model by Mr. PlanB, a well-known person on Twitter.

Instead of considering only the money supply, which as the sole input of a bitcoin pricing model has already been shown to be insufficient, I consider the Bitcoin difficulty derived from the network’s hashing speed. I have therefore tried to combine two important characteristics of Bitcoin in a single model: the money supply and its difficulty or network effect/hashing speed.

I have also considered a 20% error band that contains what I believe is the correct price of bitcoin, so -20% on the fair price and +20% on the calculated fair price. As of today, this fair price value is around $15,000, with a minimum of $12,000 and a maximum of $18,000. As you can see, at the moment bitcoin is within this price range, so it can be considered properly priced without significant excesses.

You will have noticed similarities between the two approaches, the one of the monthly averages plus deviation bands known to you and this experimental model that I recently made, both aim at $12000 as the last support, below which one could talk about a real bear market for bitcoin. If you want to make a deal, bitcoin should be bought when it is below its fair price, so try to buy as close as possible to the price range of $12 to $15 thousand that could be reached in the first half of next year.

I wanted to share with you these things that I am working on. As always, feel free to comment with your thoughts on the matter.

BTCUSD, Daily Chart, Bitcoin FairPrice Model version 1.0

This is an experimental model, it shouldn’t be used alone for proper investment decision.

Long Term Update: Will it work?

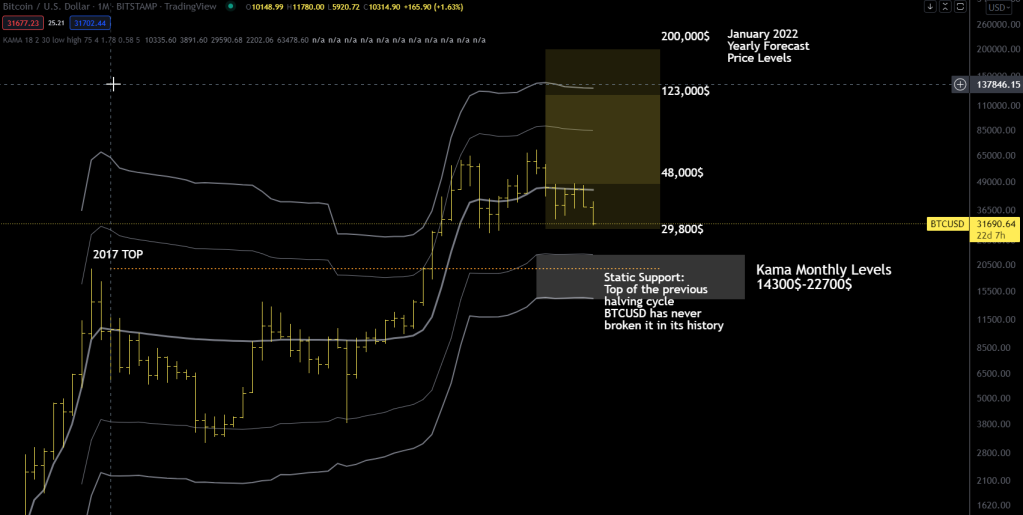
Since I published the annual forecast last January ’22, BTCUSD has already tested the lower limit of the forecast twice, at around $30,000.
I don’t know whether to interpret this behaviour as a sign of weakness or not. What is certain is that if the TOP of this halving cycle has been made it is very likely to test at least the 1st lower band of my monthly Kama average (22,700$).
Let’s see in detail the levels that I consider interesting to observe.

BTCUSD Monthly chart since 2017 Top

I would interpret as a signal of possible weakness a breach of the $29,800 level, certainly we need to consider how long bitcoin will remain below that level.
In times of temporary high volatility it would not be so serious a short permanence there; however a prolonged stay below this level would have long term bearish implications. What does this mean? It means that the games are over for this cycle and we will have to wait for the next halving of 2024, so I would say 2025, to see a new all-time high. This conclusion I guess doesn’t surprise you, by now the 4-year halving cycle of bitcoin is well known to the public.

The question is whether the price will stop at the first level of the Kama band or not. I think so, around $22,000 the support will be very strong and there will be buyers.
I exclude a severe test at the next support, around $14,000, also because bitcoin has never moved below the high of the previous halving cycle, in this case the last one was at around $19,800 in Dec. 2017; furthermore even during the corona crash the price stopped on the first lower band (at that time $3,800)
I wonder what needs to happen to see bitcoin test the second price band at $14k, if any of you have ideas please come forward 🙂

Personally, I will be a buyer again around the first support of the Kama average, around $22,000. Should an extreme level of volatility occur, I will increase the position at $14,000 with a doubled position size (1 unit at 22k$ and 2 units at 14k$) because i’ve to capitalize when volatility is at extreme levels without any fear.
See you at the next update.

Long Term Update: 2022 Outlook with entropic methods

Every year i post an outlook using entropic methods explained in the technical section of this blog. Here you can find the 2015, 2016, 2017,  2018, 2019, 2020 and 2021 forecast update, where you can find more information about this approach.

Updated values for bitcoin (in brackets values of last year) using daily data since August 2010 (average data of 4 main exchanges when possible).

   BTC/USD
Growth Factor G 1.00130 (1.00104)
Shannon Probability P (see this as entropy) 0.5254 (0.5232)
Root mean square RMS (see this as volatility) 0.049 (0.055)

Bitcoin’s entropic values versus the Usd improved during 2021,  the Growth Factor (G) grow to 1.00130% compounded daily or 160% yearly, higher then 1y ago. The optimal fraction of your total wealth to invest in bitcoin rised to 5.1%  (~0.5254*2=1.051 – 1 = 0.051 or 5.1% roundable to 5%).
Volatility continues to drop year after year and that’s normal as bitcoin gets bigger and bigger so less prone to volatility.
The BTCUSD growth factor is much better then conventional markets except the Shannon Probability that still match the US Stock Markets (around 0.522); it means that out of 100 days an asset goes up 52 days and down for 48 days, on average. I am not surprised of this because the same agents trading in conventional markets are more or less the same as those trading in the crypto market, so they have the same entropy or mental disorder.

 2022 Price forecast  Full Historical Volatility  Half Historical Volatility
Forecast using only G* ~77,000$ ~77,000$
Upper bound adding volatility ~199,000$ ~123,000$
Lower bound subtracting volatility ~29,800$ ~48,000$

*77000 is obtained with 1st January as a starting price (around 48000$) times (1.00130^365)=~1.6   |  48000*1.6=~77000, just change 365 with the number of days you prefer for a different forecast.

What happened in 2021? 

A year ago, I predicted a top of $121,000 using full volatility and about $72,000 using half of historical volatility, the latter being more likely to be hit and this is exactly what happened considering some room of error.
This market has made a low in June at $28,750, 10% above the $25,000 forecasted support level, again using half historical volatility.
During 2022 I recommend to hold your position till the upper boundary of the next cycle defined by monthly kama upper resistance bands ($80,000-$130,000) in accordance with the forecasted value of $123,000 using entropy methods and half historial volatility. 

Conclusions

As I said in the previous October update, I continue to believe that conditions in this market have changed since the other halving cycles which usually saw a Top around 19 months after the halving date. I expect a consolidation in 2022 with a slightly bullish sideways phase.
A very strong support zone remains the $30k to $48k price range that might be fine tuned during the year using Kama monthly price bands.
Should there be an excess of volatility I would advise you to take advantage of the event with some profit-taking between 120 and 200 thousand dollars; if volatility push the price down to the support area of $30,000-$48,000 do the opposite, buy:)

I’m at your disposal for any questions; see you at the next update and Happy New Year!

Charts

Bitcoin’s cumulative volatility as expected is dropping every year and is stabilizing towards a value that is still a bit high compared to other traditional assets (stocks, gold, bonds range from 0.01 to 0.03) but the very high average returns of btc compensate the high volatility. The values represent the root mean square of logarithmic returns of bitcoin daily data.
Monthly Chart BTCUSD with 2022 Price Forecast using entropic method.
The first lower monthly kama average will probably slowly reach the $30,000 level during the 2022.
I expect to find similarities between the levels calculated in the Kama indicator i use and those used with this approach, the formulas for calculating the bands in my indicator are the same as those used in this update.

Long Term Update: Will it work?

In the last update I had pointed out that it was crucial to exceed the monthly kama average (at that time around 40k usd), so bitcoin did and after a very strong bottom in July it resumed the uptrend on the monthly chart. Why a strong bottom? Because it was far above the support price zone defined by the lower bands.

At this point it is obvious that it will do a new top under the push of the ten-year old uptrend, after all bitcoin never entered a prolonged bear market since its inception.
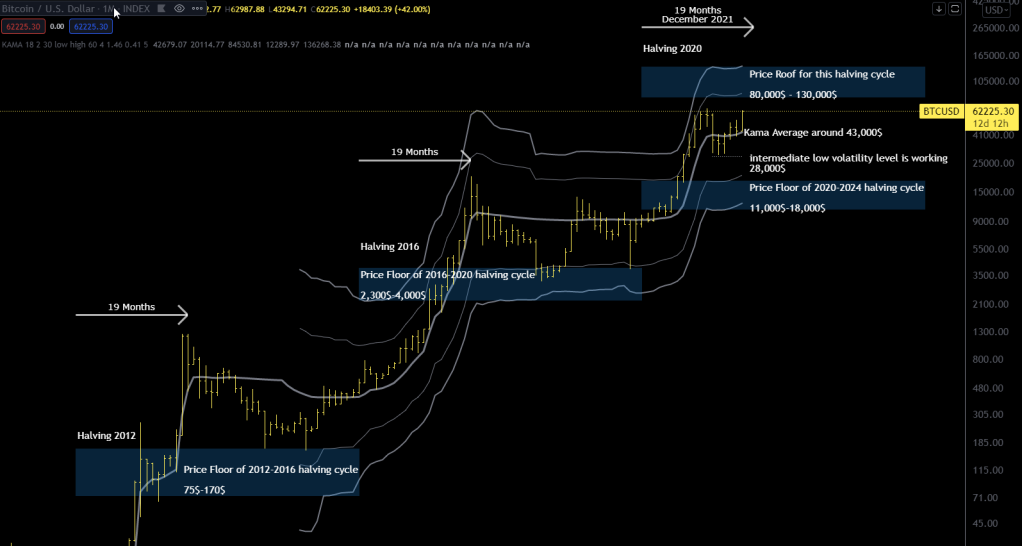
For quite some time now, thanks to the price bands, I have identified the price zone where the next top will happen, that is between 80 and 130 thousand dollars. This is the minimum target IF, and I emphasise IF, the monthly average kama will remain flat.
If you look at the attached chart you will notice that the monthly kama average is no longer flat but is going upwards, albeit slightly.

BTCUSD Monthly Chart

This fact should be kept in mind because the greater the upward slope of the average the lower the possibility that the bitcoin will stop in the resistance zone, if an asset is trending strongly you should forget the price bands.
You may have noticed in the chart this aspect of the 19 months between the halving of the block and the market high, there are already two times that this market did a top within 19 months from the halving and in this cycle the expiry date is next December, the question then arises, will it work?

I think not, the market is never so symmetrical, we are talking about non-linear dynamics here that almost never lead to a strong symmetry or repetitiveness of price patterns, so I expect it to do something different this time and there are two possibilities, or that the maximum has already been done or that bitcoin will make another even beyond 19 months from halving, I am inclined to the latter possibility with the important implication that it might go above the price resistance zone.

How to translate this into your trading operativity? For the more risk averse you could evaluate a scaling down of the position at a point of your choice in the range 80k-130k usd. For all others you could use a dynamic stop loss like “chandelier exit” to try to exploit as much as possible the current uptrend. Search for “chandelier exit” or “chandelier stop” on tradingview, you will find many versions of this indicator.

Long Term Update: Critical Point

It is always better to look, as I always say, at larger time frames to understand how to build a winning operating strategy. I invite you first to look at this monthly chart of the BTCUSD, before commenting it.

BTCUSD Monthly Chart with Kama Roof/Floor price zones

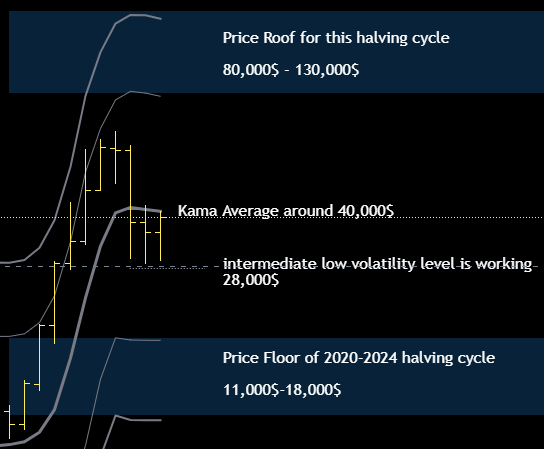
We are clearly compressed in a price range well defined by the monthly average that defines the equilibrium point of this halving cycle (2020-2024) and an intermediate level with reduced volatility (around $28,000).

A Failure to move and to stay above the monthly Kama average would be bearish in my opinion and it would clearly be followed by a decline to the support zone of this halving cycle, between $11 and $18K.

With a confirmed break of the monthly average above $40,000 then the view would change and bitcoin would return to a position of strength that should bring it towards the resistance zone located between $80 and $130,000, in accordance with what I wrote in January in my “2021 outlook with entropic methods” where upper bound level was 121,000$

Bitcoin and the top of the previous cycle rule

Because of this rule i’m very skeptic to see bitcoin at 18,000$ or even lower inside the support price zone. Bitcoin in its history never tested the price level of the top of the previous halving cycle and if 29,000$ bottom is confirmed this rule will not be broken (29,000$ is above 2017 Top at around 20,000$).

What would a bottom in this cycle below 20,000$ imply? Well, it would mean that bitcoin’s long-term trend is slowing down and we would probably have to wait for the next halving cycle, after 2024, to see a Top above the current one at $64,000. Thus, as i wrote in this post title, we are at a critical point in time to understand what scenario bitcoin will go into.

The Big Picture

BTCUSD Monthly Chart since first halving

Here you can see what I said before, the Top of a halving cycle is always lower than the bottom of the next cycle, I interpret this as a strong bullish signal of the fundamental trend of bitcoin.

To conclude many of you are probably asking why the hell i sold below 29,000$ if there was an intermediate support slightly lower, well once i define a strategy with a trailing profit order i prefer to avoid to continously change it to accomodate what the market does, i had already moved the trailing profit order from 35,000$ down to 29,000$ to contain the volatility of bitcoin and it worked for several weeks then some bad luck damaged me, however this is all part of trading and i’m not upset at all.

Short Term Update: Still bearish

We are flat, usually it happens so the market finds a strong point (where the indicator of efficiency of kama average reaches values around 0.80-0.85) and stops, at that point it can go in lateral or bounce noticeably.
In most cases we enter in a lateral phase which is now defined by the usual bands that I use (see chart below).

BTCUSD – Daily Chart

What i’d like to see is:

  • Some consolidation above daily kama average, >38,000$
  • A first breakout of the first resistance band at 41,000$
  • A test of the 2nd band at 44,000$
  • Some healthy retracement back to 41,000$ or so
  • Final break-out above 44,000$

This could be a good recipe for a trend reversal on the daily chart.

38,500$ is not only the daily kama average but also the 2nd support band on the hourly chart, i’d like to see bitcoin above it these days during a possible accumulation before to break above 41,000$.

Fix in your head that as long as we stay below $44,000 (by the way it is also the monthly Kama average) my view remains bearish.