
Network economics
By definition Network economics is business economics that benefit from the network effect (Metcalfe Law), also known as Netromix and basically is when the value of a good or service increases when others buy the same good or service. Examples are website such as EBay where the community comes together and shares thoughts to help the website become a better business organization.
Since 2010 bitcoin has been depicted as silly, a permanent bubble, denigrated by major economists, financial institutions etc…, everyone thinking that the true value of bitcoin is unknown and not knowable or zero as modern currencies have no intrinsic value because they lack scarcity or durability advantage like commodities.
The value of a currency is the use and acceptance of that currency and so they still have some value despite the fact that there are zero intrinsic value. Looking Bitcoin i can say that its value is determined by the great functions it has that are considered valuable from the user base.
MetCalfe’S Law
The problem of extrapolating future values of Bitcoin is difficult because the number of users does not grow forever, at some point you reach a saturation level as the internet, if you look historical data you can see that since 2013-2014 the internet reached maximum capacity in terms of number of worlwide hosts.
Metcalfe’s formula is:
V=n(n-1)/2
and determines the value of a network for a given n. Without entering too much in details this law says that a 5% increase in number of users should correspond to a 10% increase in the overall value of the system.
This law has already been successfully used to model the value of Facebook stock because it is strongly linked to its users, the same for bitcoin although is unclear how to estimate bitcoin number of users. A good estimation might be the number of bitcoin active addresses but all the traders providing liquidity to the system don’t do much bitcoin transactions and so they are not included in the count.
Stock To Flow Model
Recently this model is gaining popularity, i consider this model a bit optimistic in forecasting future values of bitcoin, regardless of my opinion here is the original article of the creator of this model.
My Approach
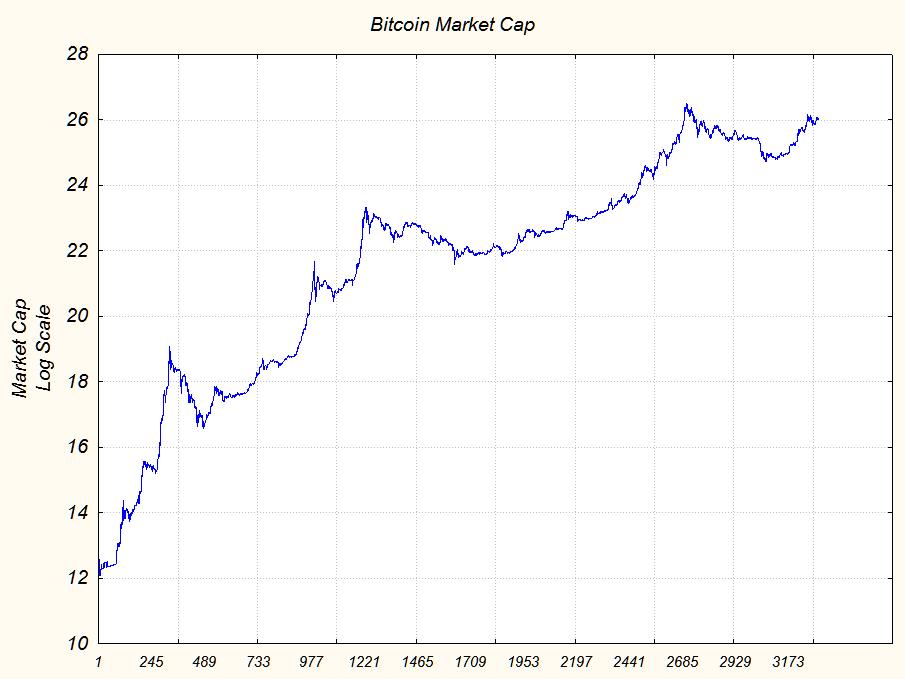
My Idea is to don’t use the Metcalfe’s Law because i can’t estimate the number of worldwide bitcoin users fairly well, i prefer to model the size of the system just looking the Market Cap instead of Price, Why? Because in the first years the Bitcoin Supply greatly changed from few btcs to some millions and this is a big distorsion not included in the price chart.
Thanks to the software i already use for my conventional trading activity i perfectly know how to derive a formula to approximate the expansion of the bitcoin system using Market Cap as metric.
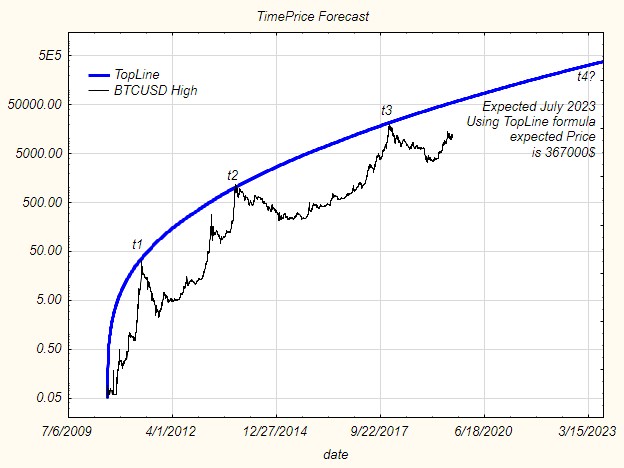
Looking the above chart it appears clear that there is a line holding bitcoin min values over time. Let’s find it!
I can’t use all the data values to find this line but i’ve to select ideal points, specifically thse are the points used:
| Date | Price |
| 17-Jul-10 | $ 0.05 |
| 8-Oct-10 | $ 0.06 |
| 7-Dec-10 | $ 0.17 |
| 4-Apr-11 | $ 0.56 |
| 23-Nov-11 | $ 1.99 |
| 2-Jun-12 | $ 5.21 |
| 8-Jan-13 | $ 13.20 |
| 26-Aug-15 | $ 198.19 |
| 22-Sep-15 | $ 224.08 |
| 17-Apr-16 | $ 414.61 |
| 25-May-16 | $ 444.63 |
| 23-Oct-16 | $ 650.32 |
| 25-Mar-17 | $ 889.08 |
| 8-Feb-19 | $ 3,350.49 |
| 25-Mar-19 | $ 3,855.21 |
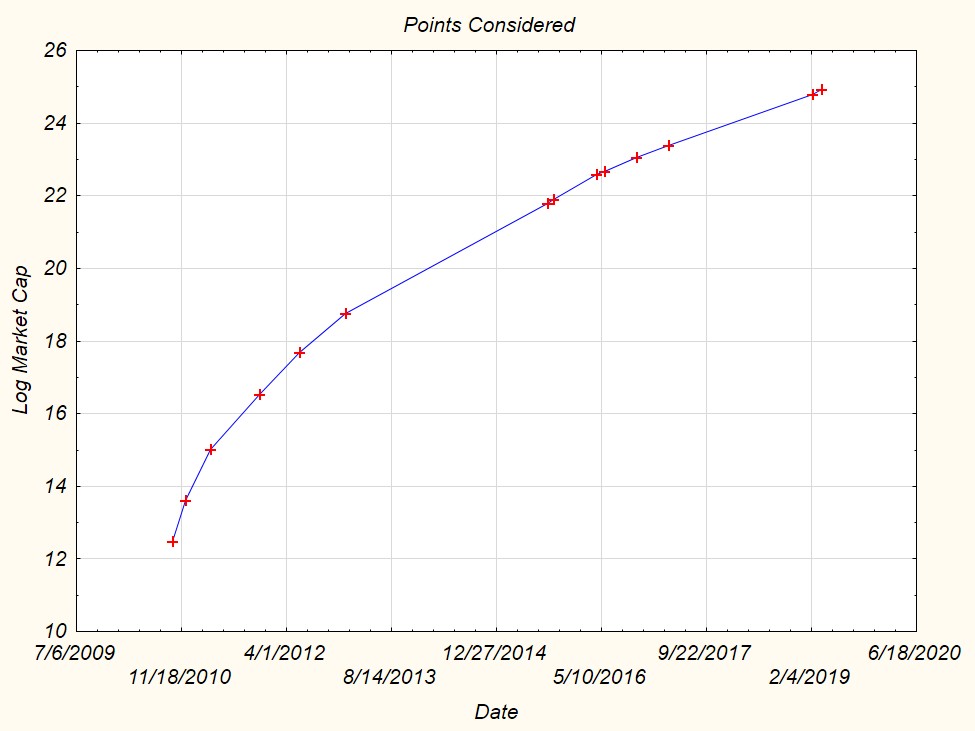
The Formula i’m going to use is this:
Log(Mcap)=constant#1+time^constant#2+constant#3*exp(time/constant#4)
The lats part of the formula is to give more credit to recent values because i’m interested to perfectly fit last data over old data that has more noise.
The best result i’ve obtained to compute the different constants is:
Log(Market Cap)~=7.775+time^0.352+(0.1*exp(-time/0.1))
From this to obtain price you have to exponentiate everything and divide by the bitcoin supply for that particulare date, time is intended in number of days since July 17, 2010

Now that i’ve a formula i can easily forecast it to see the corresponding Price for a particular date.
Next step is to do the same job to derive a formula for the Tops.
Points considered (only 4):
| Date | Price |
| 8-Jun-11 | $ 31.91 |
| 30-Nov-13 | $ 1,163.00 |
| 4-Dec-13 | $ 1,153.27 |
| 19-Dec-17 | $19,245.59 |
Skipping now to the final result:
Bitcoin Top Line = Exp(12.1929+time^(0.337559)-1.74202*Exp(-time/2.35151))/Bitcoin Supply
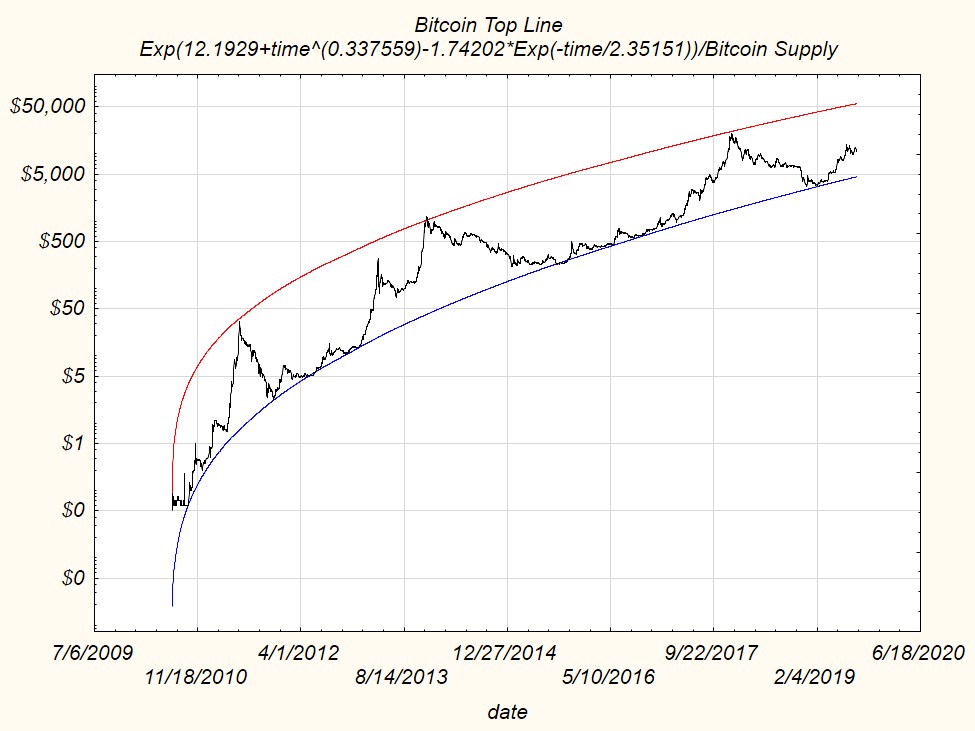
A careful observer has probably noticed that the coefficient for time is lower when calculating Tops instead of Bottoms (0.337 instead of 0.352) and there is an easy explanation for this: as long as bitcoin market cap grows in size there is more inertia and it is more difficult to manipulate the price far away from the bottom line, therefore I expect with the passage of time to have the next important Tops closer and closer to the reference line or bottom line or if you prefer the “Fair Price Line”, call it as you want.
4 Years in to the Future
Once you have a model to define the boundaries where bitcoin price moves is easy to do a forecast and have a look where bitcoin might go in the next years. Here i propose a four years look in to the future.
Before let’see very quickly a third line very important: the MIDLINE. I computed it using all available data points since July 2010. Here the result plus the 4 years forecast:
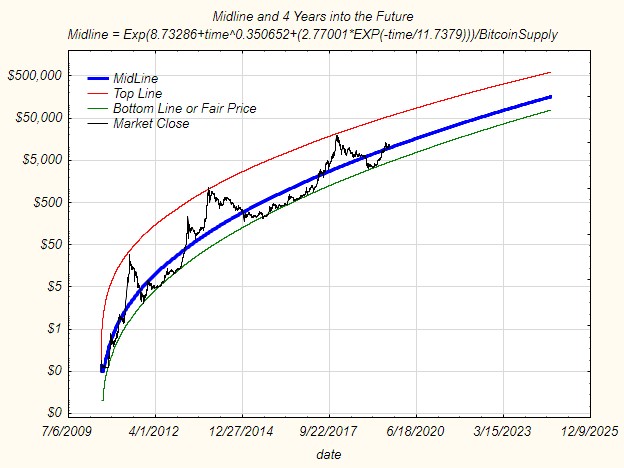
I really like the result achieved with this model, apart the perfect fitting of all bottom and top points even the Mid Line is very important to understand where is the boundary between Fair Price and Overprice.
Furthermore bitcoin spends not much time above the Mid Line and very few days near the Top Line. Moreover the time spent below the Mid Line is equal to 62% and 38% of the time bitcoin price is above the Mid Line, I don’t know if Fibonacci is involved or not but the coincidence is odd.
Looking the above chart 4 years from now the forecasted price is impressive, i highly doubt the Top Line will work but i’d be already satisfied if Bitcoin will stay above the Bottom Line or Fair Price line, for your curiosity next September 2023 bottom line is at 47000$.
Timing the next All Time High, is it possible or not?
Well, looking the chart out careful observer probably noticed that there is a progression in time between all the Tops. Have a look:
- First top happened after 327 days since July 17, 2010.
- Second top after around 1235 days.
- Third top after 2713 days.
Using the same approach used to derive previous formulas the formula for this numerical progression is:
TopDate=323.5*TopNumber^1.9354
Topnumber is the # of top considered, 4 for the next one and we obtain 4733 days since July 17, 2010 that is due on July 2, 2023. Knowing the time, just look for the price in the TopLine using my formula and the corresponding price is around 367000$.
I recognize that it is very ambitious to predict in advance of 4 years the next Top but I have extrapolated to the future what i observe today on the historical data.
I know that many of you are already asking “why is required so much time for the next top?” I think the answer is that due to the big growth of the bitcoin ecosystem this growth process is slowing down with the pass of time and therefore more and more time is needed for each new bubble to develop.
This will not mean that bitcoin price will stay all the time below my MidLine, some mini bubble might occurs in the next years and I’ll work on this subject to identify Intermediate Levels to accurately predict where these mini-bubble will end.
For example the recent June 26 Top at 13880$ happened outside the MidLine indicating that Bitcoin price was a bit overpriced. At that time the Midline was at 9050$ and Bitcoin at 13880$ was overpriced by 53%.
This month of September the Midline will move from 10150$ to 10650$ and bitcoin these days is rising to recover that line after a quick drop to 9320$.
Next Thing To Do
As i said i’m satisfied with the result obtained also in terms of R2 of my regression of Tops/Bottoms points, R2 is around 0.99 or basically a perfect FIT of the data points. Of course academically speaking my model doesn’t pass the infamous Durbin-Watson test because the residual of my model has some autocorrelation (as it has also the stock to flow model proposed by PlanB). By the way an academic invalidated model doesn’t mean it will not work but we must play by the rules.
Said this i’ve to found a way to model the distance between my Fair Price Line or Bottom Line and Bitcoin Price trying to have residual without autocorrelation and i’ll probably fail. Why? Because it is difficult to model price behaviour if there is fraudolent activity going on as it could have happened during 2013 with the famous bot “Willy” pumping prices at MtGox or recent manipulation by hedge funds that pushed the price from the fair value of 800$ (January 2017) up to 19800$.
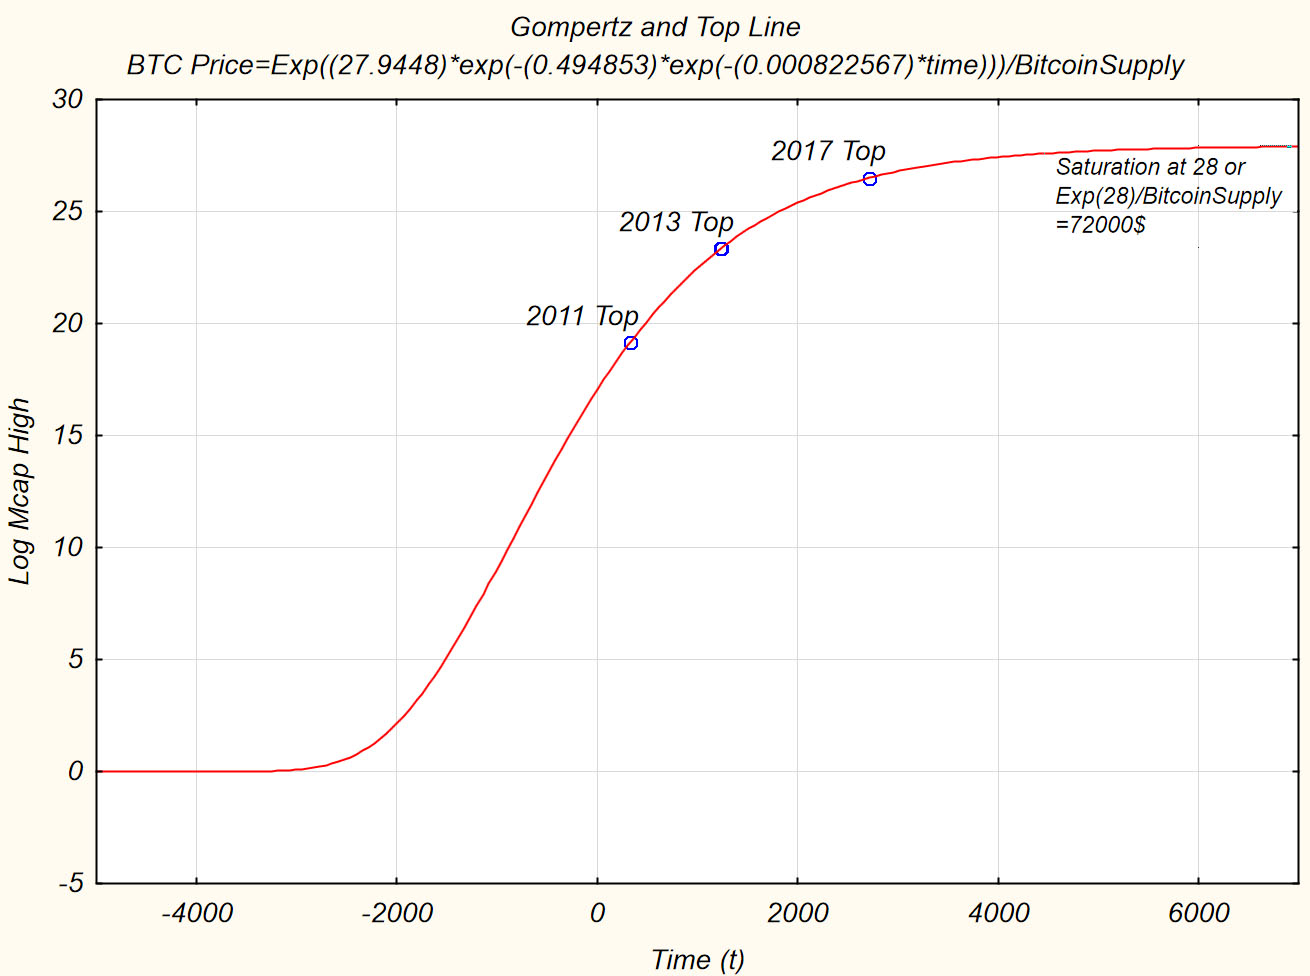
Final Considerations and Gompertz
Benjamin Gompertz is the author of a sigmoid function which describes growth as being slowest at the start and end of a given time period and the future value asymptote of the function is approached more gradually by the curve than the left-hand or lower valued asymptote. I started this article talking about the importance of the user base as a way to simulate saturation because there is a limited number of users that limit the growth of a system, and now i conclude this article trying to model bitcoin price using the formula provided by Mr.Gompertz.
The formula is:
Price=Exp(27.3225*Exp(-0.682014*Exp(-0.00061457*time)))/BitcoinSupply
Time as usual is counted in days since July 17 , 2010.
In the below chart there is a comparison between the above formula and the formula for the Bottom Line or Fair Price Line.
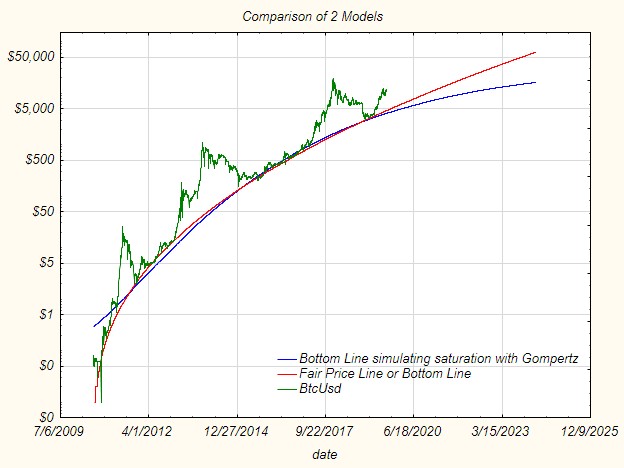
As you can see simulating saturation lower the Fair Price of Btc in a significative way. The saturation point is around 26000$, instead working with tops the saturation point is 72000$, here is the chart:
There is a big consideration to do about this attempt to simulate the saturation of the bitcoin system, the quality of the user base.
I can’t know if in the upcoming years the user base wealth distribution will remain the same or not, if there will be a new influx of user with more money because attracted by the “digital gold” aspect of bitcoin this will surely push bitcoin prices above the forecasted range of 26-72 k$ of this model.
Another consideration looking the last chart is that the starting point is well in the past, 4000 days before July 2010 or December 1999, it is a date close where everything started, the publication of “BitGold” by Nick Szabo, a direct precursor to the Bitcoin architecture.
For now i stay stick with my first model that doesn’t include saturation but i’ll keep an eye on my second model.
Thank you for your attention and I hope to have been quite clear and detailed, as always if you have any questions do not hesitate to leave a comment or write to me on Twitter.

Very interesting, thanks for the update, Enky!
I’ll return to this article with something new in the upcoming weeks, stay tuned.
thank you so much Enky for this fantastic script… As far as I can see it has been very well founded and professionally worked out by you. Unfortunately I am not a programmer / mathematician so I was not able to modify the script in a way that your three curves will reach into the future like in the picture in your blog article. If you don’t mind it would be great if you could also post a modified script or publish it on tradingview that will last in the future. Thanks a lot manuel
I think it’s a limit of tradingview platform and can’t be bypassed, prolly. I’ll investigate further to be sure of this.