Weekly Range Update: Over 4300$

XBTUSD dailychart
XBTUSD dailychart

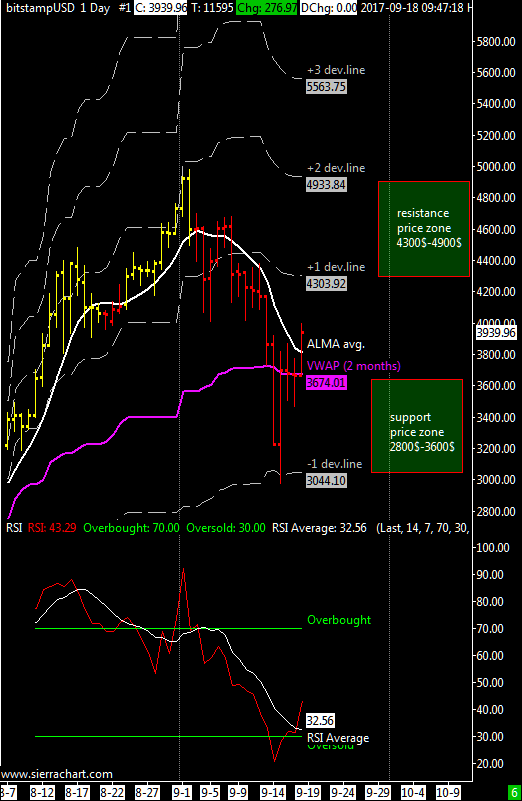
XBT/USD weekly price range at 4300$-4800$ | There is an unusual situation this week, the 2-month VWAP average is flat since the bottom of 15 September, therefore neutral trend for the short term. However, the market has surpassed the resistance value I mentioned last week, at $4300, this is a positive note.

To bring the short-term trend back to the upside we need to stay above $4300 at least for the whole week. The resistances shown in the graph range from 4800 to 5250 dollars.

In the previous update I had suggested to my readers a short term long operation from about 3600$, who followed this “trading idea” will surely have had a decent profit, I invite you all to keep this operation open as long as the XBTUSD cross will remain above $4300, below this level I suggest to close the position.

The RSI, as I said last week, has already given a sign of purchase that is now confirmed by its average which is on the rise, however we have not yet entered the overbought area leaving margin for a possible rise up to $4800.

In the event of an unexpected catastrophic news, the support area on the weekly chart rises to 2100-2600 USD.

ITA version here.

Weekly Range Update

bitstampUSD 1 Day #1 2017-09-18 09_48_01.095
XBTUSD Daily Chart – VWAP Levels

XBT/USD weekly price range at 3650$-4300$ | As I wrote on twitter the market found support within the support area of my previous update that had a lower limit of $2800. I would like to point out that I will not increase my long-term position opened between 2014 and 2015, but I will tell you when there will be a buying opportunity.

Today’s reaction is positive and I believe that in 1-2 days the ALMA moving average will turn upwards together with the average of the RSI oscillator.

The RSI has already given a purchase signal, but it is better to confirm it when its average slope will also turn positive.
When these conditions are met we will have a buying opportunity.

In the event of a catastrophic news, the support area on the weekly chart remains unchanged at 2000-2500 US Dollars.

ITA version here.

Weekly Range Update: waiting the Sec

XBTUSD daily chart - VWAP Lines
XBTUSD daily chart – VWAP Lines

XBT / USD weekly price range 1125$- 1300$ | The range for this week is intended valid until the SEC decision of next 11 March whether to approve or not the first bitcoin ETF; this is an event that can create additional volatility that can push this market well beyond the 1300$ resistance or generate a violent correction down to the VWAP, now at ~950$.

The ALMA moving average remains firmly upward; as you can see in the left attached chart in a strong uptrend hardly the minimum of the day is below this reference average I use.

The RSI oscillator is in overbought zone and essentially confirms that the market is strong but still a top could be in the making. There is also a strong resistance in the weekly chart around 1370$-1400$.

In cases of extreme fall the support area is updated to 610-740 USD.

ITA version here at bitchanger.com

Weekly Range Update

eng
Daily Chart XBTUSD

XBT / USD weekly price range is 865$-965$ | The XBTUSD cross has moved above the VWAP regaining a position of strength, for this week the main resistance is the price zone between the first and the second deviation line or the 965$-1070$ price range; This technical rebound should stop in this price range (970$-1070$ ) now we need to wait to see where will be done the next relative maximum to understand how it is positioned in the medium term, given the situation of the weekly chart I expect that the next top will be lower then the other one of 3 January done approx at 1170$.

As support it is valid the first negative deviation line VWAP at around $ 765 although I feel that the last minimum done at $750 is confirmed and i think to be right considering now the VWAP at 865$ as main support for this week and probably the next one.

The daily RSI oscillator average has reversed to the upside but without going into oversold first, thus great buying opportunities have not yet been materialized.

In cases of extreme fall the support area run from 590 to 680 USD.

ITA version here at bitchanger.com